The World Gold Council released its 3Q demand and supply statistics today (from research group Metals Focus). The summary page does a good job in explaining their key findings.
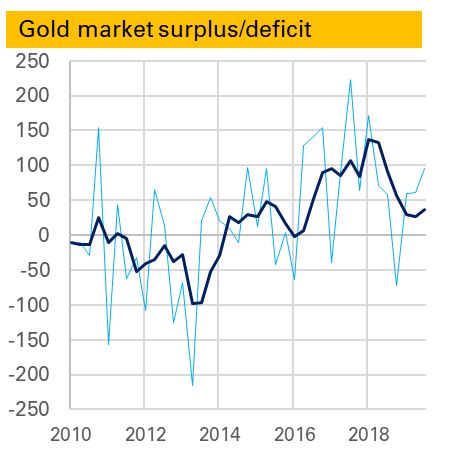
One thing I always look out for is the S&D balance, and in particular the surplus/deficit. From late 2016 the gold market entered a period of very large surpluses – totalling 361t in 2016, 336t in 2017 and 229t in 2018.
It is not clear what this was. It was not ETF demand as that is included separately. It might be what it once would have been called – “western implied investment”. But it no longer correlated to Comex positions. More likely it was to do with China, which had imported more gold than it has apparently consumed in other forms. Whether it was investment, e..g by HNW individuals, or something else, perhaps leased gold, is still unknown. But it didn’t seem particularly bullish – in fact it felt more like a classic price-weighing surplus.
Towards the end of last year the surplus began to fall. The first chart shows both the quarterly surplus, in light blue, and the rolling 12m average, both in tonnes. A big quarterly deficit in 4Q 2018 reduced the average sharply and so far this year though it has totalled 217t, that is down from 300t in the first three quarters of 2018.
So should we be concerned that the defiict in the most recent quarter, 3Q 2019 was higher than 3Q 2017 (95t to 57t)? Probably not. After all the gold price has been strong, and as such the surplus seems more likely to reflect unidentified investment. As I noted before deficits can be bearish – the corollary is surpluses can be bullish.
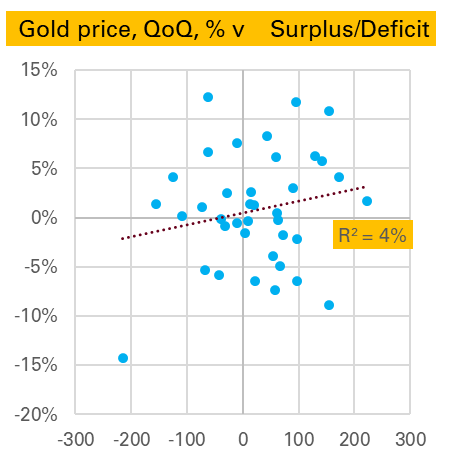
That said, the 2nd chart, which shows the QoQ change in the gold price (edit – note this is logged change) v the surplus-deficit shows little clear relationship either way (though gold’s largest price fall, in 2Q 2013, did match up to its largest deficit).
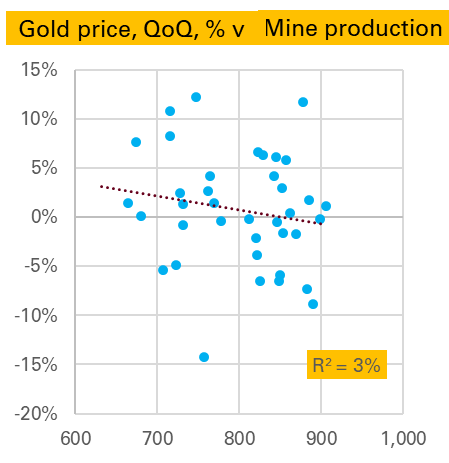
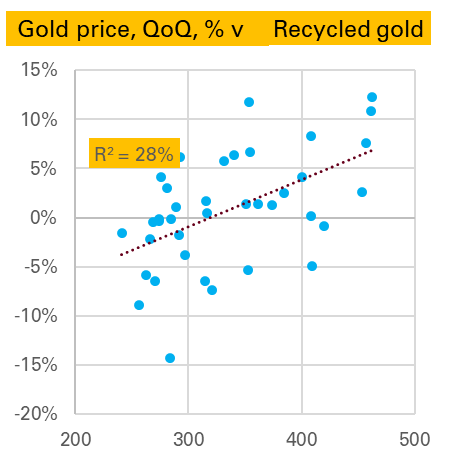
A similar analysis can be done for the other line items in the S&D balance. Starting with supply, as might be expected there is no relationship between changes in the gold price and the level of mine production 1. But there is a stronger one between changes in the gold price and the level of scrap generation 2 .
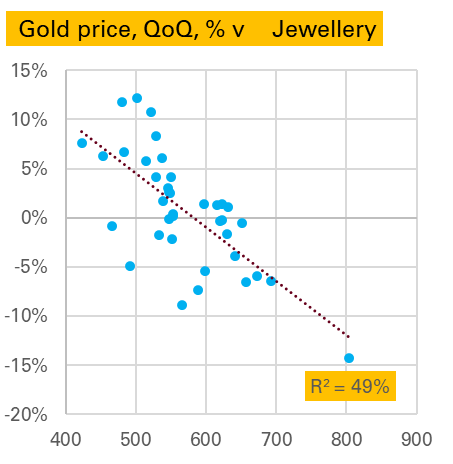
On the demand side jewellery is very interesting, with a strong negative relationship. That is in a quarter when the gold price falls a lot, jewellery demand is high, and in a quarter when the gold price rises a lot jewellery demand is weak. The causation here seems obvious, from price to demand, as the other way around makes little sense. 3. To some extent this is driven by 2Q 2013 again, though it would be wrong to exclude this as that was exactly the kind of price-driven buying we are expecting, and anyway the relationship is nearly as good if we do exclude it.
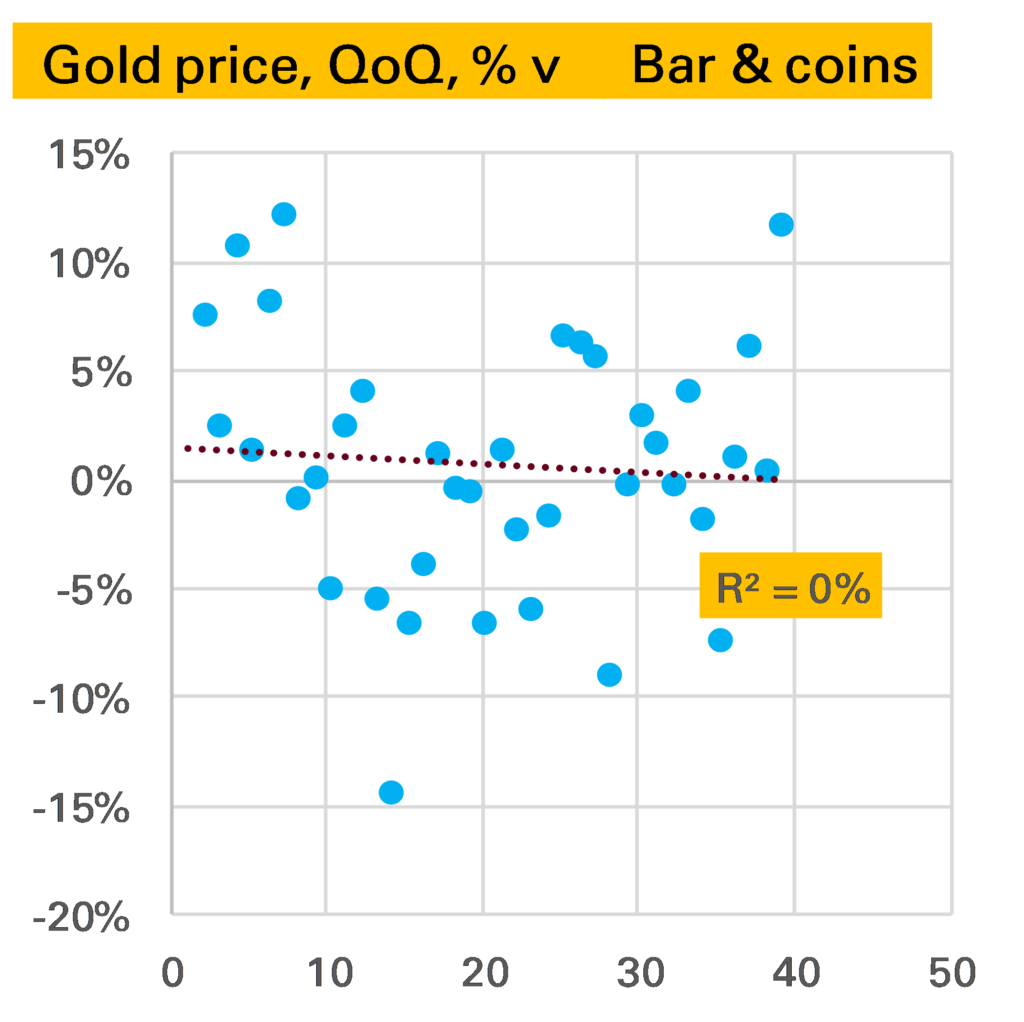
Bar & coin demand surprisingly, shows very little relationship, either in levels (shown in chart) or changes.
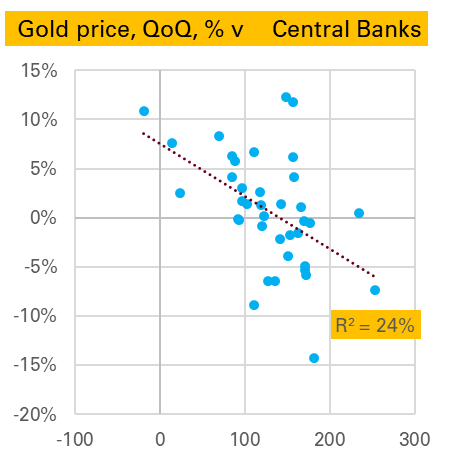
Finally we end with two strong correlations. The first is puzzling. Apparently central banks like selling gold in quarters when the price has risen and like buying it when the price is falling. This suggests a certain savviness and speed not usually associated with the official sector, but might be explained by them targeting a fixed $ amount of gold. More research is needed – and indeed more quarters in which central banks are net sellers, with only one datapoint since 2010.
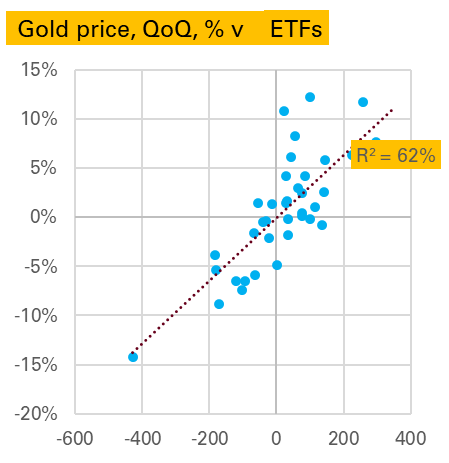
The next is more intuitive. ETF flows are much larger in quarters when the price is rising and lower when it is falling. Are investors trend followers? More likely they are price-setters, with large short-term physical flows driving the price in either direction.
Source: All charts World Gold Council, Gold Demand Trends (data from Metals Focus)
Notes:
- If you think it would be stronger against the change in mine production – it’s not ↩
- Here though, and elsewhere, there is probably some modelling relationship being captured given the difficulty in directly measuring such flows ↩
- Interestingly this correlation is strong, but not stronger, if we use the change in demand ↩
